lessons
1.1 Units & orders of magnitude, one level deeper1.2a Errors: what they look like on a graph1.2b Uncertainty of a measurement: the fine print1.2c Propagating uncertainties: why the rules work1.2d Gradients: turning a curve into a straight line1.3 Vectors: any angle, rivers, and changes in velocity2.1 Describing motion: averages and signs2.2–2.4 Where the three equations come from2.2–2.4 Exam special 1: objects thrown upward2.2–2.4 Exam special 2: two-stage (and more) motion2.5 Reading graphs like an examiner★ How it all fits together1.1 Units & orders of magnitude, one level deeper
🔬 Going deeper: why it works
A prefix is just a hidden power of ten, so it obeys the power rules. When a unit is squared or cubed, the prefix is squared or cubed too: 1 cm = 10−2 m, so 1 cm² = (10−2)² m² = 10−4 m², and 1 cm³ = 10−6 m³.
Units also let you check an equation. Every term that is added must have the same unit. In s = ut + ½at²: ut has (m/s)(s) = m and at² has (m/s²)(s²) = m. Both are metres, so the equation is at least possible. Numbers like ½ have no unit.
⚪ Worked example: Area and volume conversions (the classic trap)
- 2.5 cm² in m²: 2.5 × 10⁻⁴ m² (not 2.5 × 10⁻²).
- Density 7.8 g/cm³ in kg/m³: 7.8 g = 7.8 × 10⁻³ kg and 1 cm³ = 10−6 m³.
- 7.8 × 10⁻³ ÷ 10−6 = 7.8 × 10³ kg m−3 = 7800 kg/m³. (Shortcut: g/cm³ × 1000 = kg/m³.)
⚪ Worked example: Is v² = u² + 2as even possible? (unit check)
- v² and u²: (m s−1)² = m² s−2.
- 2as: (m s−2)(m) = m² s−2.
- All terms match, so the units balance ✓. If you misremember it as v² = u² + 2at, the last term is m s−1: wrong units, so the equation must be wrong.
⚪ Worked example: Order of magnitude when the number is not tidy
- Light takes t = d ÷ c = 1.5 × 10¹¹ m ÷ 3.0 × 10⁸ m/s = 500 s to reach us from the Sun.
- 500 = 5 × 10². Since 5 > 3.16 (= √10), round up: order of magnitude 10³ s, not 10².
- Comparing sizes: atom ≈ 10−10 m, nucleus ≈ 10−15 m. Ratio = 10−10 ÷ 10−15 = 105, so the atom is 5 orders of magnitude bigger.
🕵️ How examiners trick you
- A density or area in cm-units: they hope you multiply by 100 once, not 10 000 or 1 000 000.
- "Give your answer to an appropriate number of significant figures": match the least precise data value (usually 2 or 3 s.f.).
- Hours and minutes hidden in a kinematics question (65 miles in 2.5 hours): convert time to seconds and distance to metres before using SUVAT if they ask for SI units.
- Orders of magnitude for numbers like 4 × 10⁶: the answer is 107, because 4 > 3.16.
🔗 Links to other topics
Unit checking works for every formula in this guide: an uncertainty has the same unit as its value (except % and fractional ones, which have none); a gradient has unit y-unit ÷ x-unit (topic 1.2d); every SUVAT term in a displacement equation is in metres (topic 2).
Squared/cubed unit → square/cube the prefix: cm² = 10⁻⁴ m², cm³ = 10⁻⁶ m³.
Terms that are added must have the same unit.
Order-of-magnitude cut-off is 3.16, not 5.
1.2a Errors: what they look like on a graph
🔬 Going deeper: why it works
The two error types leave different "fingerprints". Random errors make points scatter above and below the best-fit line. Systematic errors move every point by the same amount, so the whole line shifts: it no longer goes through the origin even when theory says it should.
A pure zero error (e.g. a ruler whose zero is worn off) changes the intercept but not the gradient. That is why scientists like to find answers from gradients: a zero error cannot spoil them.
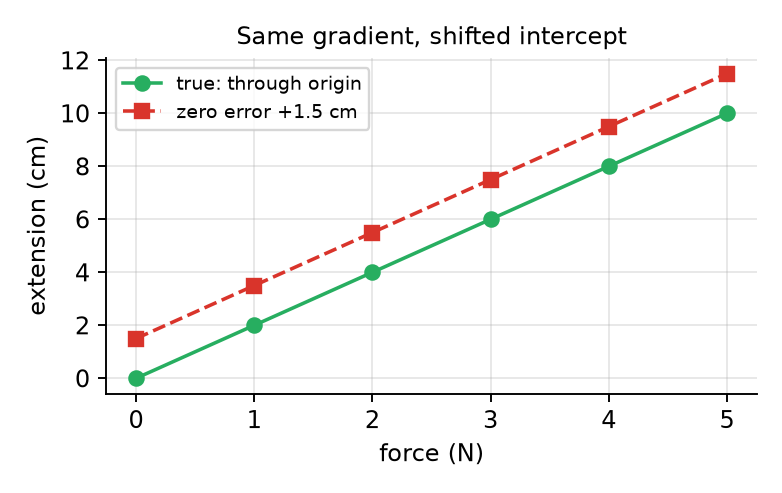
A spring stretched by a force, measured with a ruler that has a +1.5 cm zero error.
⚪ Worked example: Making a random error smaller: timing many swings
- A pendulum swing takes about 1.6 s. Human reaction time makes each stopwatch reading uncertain by about ±0.2 s.
- Timing ONE swing: (1.6 ± 0.2) s → 0.2 ÷ 1.6 = 12.5%.
- Timing TEN swings: (15.6 ± 0.2) s. One swing = 15.6 ÷ 10 = 1.56 s, and the uncertainty is also divided by 10: ± 0.02 s.
- Now 0.02 ÷ 1.56 = 1.3%. Same stopwatch, about ten times better.
⚪ Worked example: Spotting the error type from data
- Mass readings on a balance that shows 0.12 g with nothing on it: 50.12 g, 50.13 g, 50.12 g.
- Very close together → precise (small random error).
- Every reading is 0.12 g too big → systematic (zero) error → not accurate.
- Fix: tare/zero the balance, or subtract 0.12 g from each reading → 50.00 g, 50.01 g, 50.00 g.
🕵️ How examiners trick you
- "Resolution" is not "accuracy": a thermometer that reads to 0.1 °C is precise in its readings, but it could still be badly calibrated (worksheet 2, Q5 idea).
- "Zero offset error affects…": only the accuracy, because every reading moves by the same amount (worksheet 2, Q2 idea).
- Parallax: always reading a scale from above is systematic (same direction every time); reading from random angles is random.
- "Repeat and average" never removes a systematic error. They often put it as a wrong option.
🔗 Links to other topics
Random error → size of the uncertainty (1.2b) and the scatter of points around the line (1.2d). Systematic error → a non-zero intercept (1.2d). Reaction time is why timing in free-fall experiments (topic 2) has big % uncertainty.
Random = scatter around the line; systematic = whole line shifted.
Zero error changes the intercept, not the gradient.
Measure many swings/oscillations to shrink the % uncertainty.
1.2b Uncertainty of a measurement: the fine print
🔬 Going deeper: why it works
Why half the range? If readings run from 2.31 s to 2.45 s, the mean sits roughly in the middle. Half the range (±0.07 s) reaches from the mean to both extremes, so it covers almost all the readings without exaggerating.
Why round the value to match the uncertainty? If you only know a time to ±0.07 s, writing 2.385 s pretends you know the thousandths. The last digit of the value should sit in the same decimal place as the uncertainty.
The weak link. The measurement with the biggest percentage uncertainty spoils the result most, so that is the one to improve.
⚪ Worked example: Four repeated readings
- Readings: 2.31 s, 2.45 s, 2.38 s, 2.40 s.
- Mean = (2.31 + 2.45 + 2.38 + 2.40) ÷ 4 = 9.54 ÷ 4 = 2.385 s.
- Half range = (2.45 − 2.31) ÷ 2 = 0.07 s.
- Round the value to 2 decimal places, to match: (2.39 ± 0.07) s. In % terms: 0.07 ÷ 2.39 = 2.9%.
⚪ Worked example: Which measurement should be improved?
- A student measures a ramp length (50.0 ± 0.1) cm and the time to roll down it (2.4 ± 0.2) s.
- % for length = 0.1 ÷ 50.0 × 100% = 0.2%.
- % for time = 0.2 ÷ 2.4 × 100% = 8.3%.
- The time is about 40 times worse. Improve the timing (light gates, or a longer ramp so the time is bigger). A better ruler would make almost no difference.
⚪ Worked example: Going backwards: from % to ± form
- A mass is 0.450 kg with a 4% uncertainty.
- Δm = 4 ÷ 100 × 0.450 = 0.018 kg.
- Write it as (0.450 ± 0.018) kg, or to 1 s.f. (0.45 ± 0.02) kg.
🕵️ How examiners trick you
- They give an uncertainty like ±0.18 with a value 12.0 and ask you to "state correctly". Keep the decimal places matched: (12.0 ± 0.2) V.
- Multiple-choice options like 7.77 ± 0.185 or 7.773 ± 0.16: one has too many digits in the uncertainty, the other in the value. Pick the one where both stop at the same decimal place.
- A ruler length needs TWO readings (both ends), so ±0.1 cm, not ±0.05 cm.
- Fractional uncertainty has NO unit and is not multiplied by 100. Percentage is.
🔗 Links to other topics
These ± values are exactly what you feed into propagation (1.2c) and what you draw as error bars (1.2d).
Repeats: mean ± half range.
Match the decimal places of value and uncertainty.
Biggest % uncertainty = weak link to improve.
1.2c Propagating uncertainties: why the rules work
🔬 Going deeper: why it works
Adding: if a = 10 ± 1 and b = 5 ± 1, the biggest possible a + b is 11 + 6 = 17 and the smallest is 9 + 4 = 13. That is 15 ± 2, so the absolute uncertainties add. Subtracting: the biggest a − b is 11 − 4 = 7 and the smallest 9 − 6 = 3, so 5 ± 2. They still add! The wobbles never cancel, because you do not know which way each one goes.
Multiplying: look at the picture. A rectangle a × b grows by two strips, bΔa and aΔb (plus a tiny corner). Divide the extra area by ab: Δa/a + Δb/b. So the fractional (%) uncertainties add.
Powers: a² = a × a, so its % is %a + %a = 2 × %a. a³ → 3 × %a. A square root is a power of ½, so √a has ½ × %a.
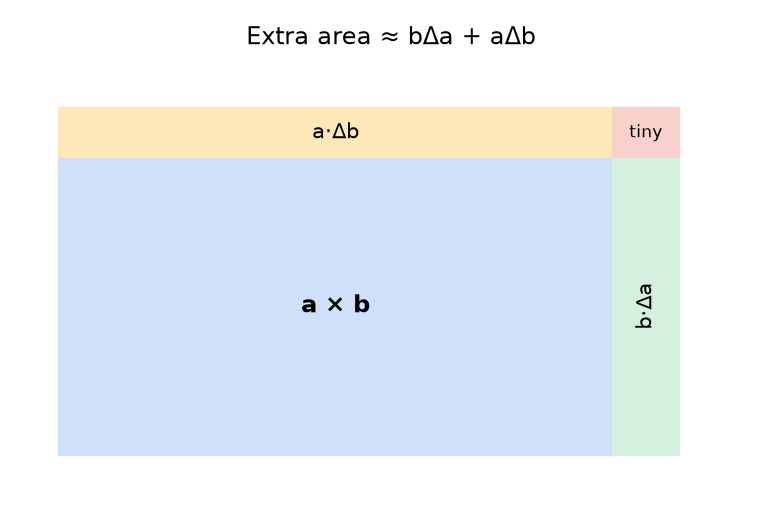
Why % uncertainties add when you multiply.
⚪ Worked example: Pendulum: a power in the denominator
- g = 4π²L ÷ T², with L = (0.800 ± 0.005) m and T = (1.80 ± 0.02) s.
- Value: g = 4 × π² × 0.800 ÷ 1.80² = 31.58 ÷ 3.24 = 9.75 m s−2.
- %L = 0.005 ÷ 0.800 = 0.625%. %T = 0.02 ÷ 1.80 = 1.11%.
- T is squared → 2 × 1.11% = 2.22%. Dividing still means ADD: 0.625% + 2.22% = 2.85%. (4π² is exact: 0%.)
- Δg = 0.0285 × 9.75 = 0.28 → g = (9.7 ± 0.3) m s−2.
⚪ Worked example: Cylinder from its diameter
- V = πr²h = π(d/2)²h, with d = (2.00 ± 0.02) cm, h = (10.0 ± 0.1) cm.
- V = π × 1.00² × 10.0 = 31.4 cm³.
- %d = 1%, squared → 2%. %h = 1%. Total 3%. (Halving d to get r does not change the %.)
- ΔV = 0.03 × 31.4 = 0.94 → (31.4 ± 0.9) cm³.
⚪ Worked example: Two-step: subtract first, then divide
- A trolley passes marks at d₁ = (10.0 ± 0.1) m and d₂ = (50.0 ± 0.1) m, taking t = (4.0 ± 0.1) s between them.
- Step 1 (subtract → add absolutes): Δd = 40.0 m ± 0.2 m → 0.2 ÷ 40.0 = 0.5%.
- Step 2 (divide → add %): %t = 0.1 ÷ 4.0 = 2.5%. Total 0.5% + 2.5% = 3.0%.
- v = 40.0 ÷ 4.0 = 10.0 m/s; Δv = 0.030 × 10.0 = 0.3 → v = (10.0 ± 0.3) m s−1.
⚪ Worked example: Cubes blow up fast
- A cube has side L = (2.0 ± 0.1) cm. Volume V = L³ = 8.0 cm³.
- %L = 0.1 ÷ 2.0 = 5%. Cubed → 3 × 5% = 15%.
- ΔV = 0.15 × 8.0 = 1.2 → (8.0 ± 1.2) cm³. A 5% wobble on the side becomes 15% on the volume.
🕵️ How examiners trick you
- Subtracting two close values: (5.2 ± 0.1) − (4.9 ± 0.1) = 0.3 ± 0.2. That is a 67% uncertainty! They like asking which result is "least reliable".
- Formula with a number in front (½kx², 2L + 2W): ½ has no uncertainty; but 2L means L + L, so Δ(2L) = 2ΔL.
- Square roots: they hope you double the %. For √ you HALVE it.
- Multiple choice with % only (cylinder, pV = nRT): just add the % with the powers as multipliers. No need to find the value.
- Mixed formulas (density by displacement): do the + or − part first with absolutes, convert to %, then do × or ÷.
🔗 Links to other topics
Kinematics formulas are full of powers: s = ½at² (time squared → 2 × %t), v² = u² + 2as. Topic 1.2d uses the same idea for gradients. And the unit of every Δ is the unit of its quantity (1.1).
+ or −: add absolutes (always add, even for minus).
× or ÷: add %. Power n: n × %. Root: ½ × %.
Mixed formula: do brackets/sums first, then the % part.
1.2d Gradients: turning a curve into a straight line
🔬 Going deeper: why it works
A straight line is easy to analyse: gradient and intercept. But s against t for a falling ball is a curve. The trick is linearising: compare the formula with y = mx + c.
From rest, s = ½gt². If we plot s on the y-axis and t² on the x-axis, then y = s, x = t², m = ½g, c = 0. The curve becomes a straight line through the origin, and g = 2 × gradient. This is exactly why worksheet 2 Q10 asks you to plot s against t².
For error bars on t², use the power rule: %(t²) = 2 × %t, so Δ(t²) = 2tΔt.
⚪ Worked example: A free-fall data set (h ± 0.01 m, t ± 0.005 s)
| h (m) | t (s) | t² (s²) | Δt² = 2tΔt |
|---|---|---|---|
| 0.20 | 0.205 | 0.0420 | 0.0020 |
| 0.40 | 0.284 | 0.0807 | 0.0028 |
| 0.60 | 0.352 | 0.1239 | 0.0035 |
| 0.80 | 0.401 | 0.1608 | 0.0040 |
| 1.00 | 0.454 | 0.2061 | 0.0045 |
- Best-fit line gradient = 4.89 m s−2 (intercept almost 0, as expected).
- Steepest line: from the bottom-right corner of the first box (0.0441, 0.19) to the top-left corner of the last (0.2016, 1.01): mmax = 5.21.
- Shallowest line: top-left of first box to bottom-right of last: mmin = 4.57.
- Δm = (5.21 − 4.57) ÷ 2 = 0.32. Gradient = (4.9 ± 0.3) m s−2.
- g = 2 × gradient: g = 9.8 ± 0.6 → g = (9.8 ± 0.6) m s−2. (Doubling a value doubles its absolute uncertainty; the % stays the same.)
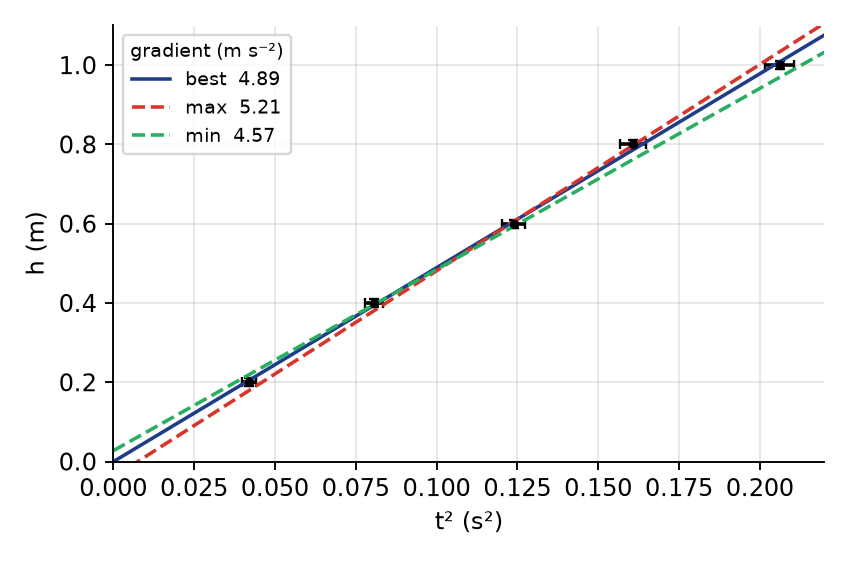
Error bars drawn, plus best, steepest and shallowest lines.
🔬 Going deeper: why it works
Anomalous points: a point clearly off the pattern (in Q10, the 0.500 m row has a SMALLER time than the 0.450 m row, which is impossible for a ball falling further) is circled and left out of the line. Intercept meaning: a non-zero intercept means a systematic error, for example a timer that starts late (topic 1.2a).
🕵️ How examiners trick you
- Using table values instead of points read off your line for the gradient.
- Gradient units: (unit of y) ÷ (unit of x). For s vs t²: m ÷ s² = m s−2.
- Asking for g when the graph gives ½g: remember to double.
- Max/min lines must pass through EVERY error box, not just most of them.
- "Explain why we plot t² and not t": because s ∝ t², so only s vs t² gives a straight line.
🔗 Links to other topics
This one topic pulls together kinematics (s = ut + ½at² with u = 0), power-rule uncertainties (Δt² = 2tΔt), and systematic errors (intercept).
Compare with y = mx + c to choose the axes.
s vs t² → gradient = ½g (or ½a).
Δm = (mmax − mmin) ÷ 2; leave anomalies out.
1.3 Vectors: any angle, rivers, and changes in velocity
🔬 Going deeper: why it works
Pythagoras only works when two vectors are at 90°. For any angle, split every vector into x and y components, add the x parts, add the y parts, then rebuild: R = √(Rx² + Ry²), θ = tan−1(Ry ÷ Rx).
This works because perpendicular directions are independent: a push sideways does nothing to motion forwards. It is the same reason a boat crosses a river in the same time whether or not the river flows.
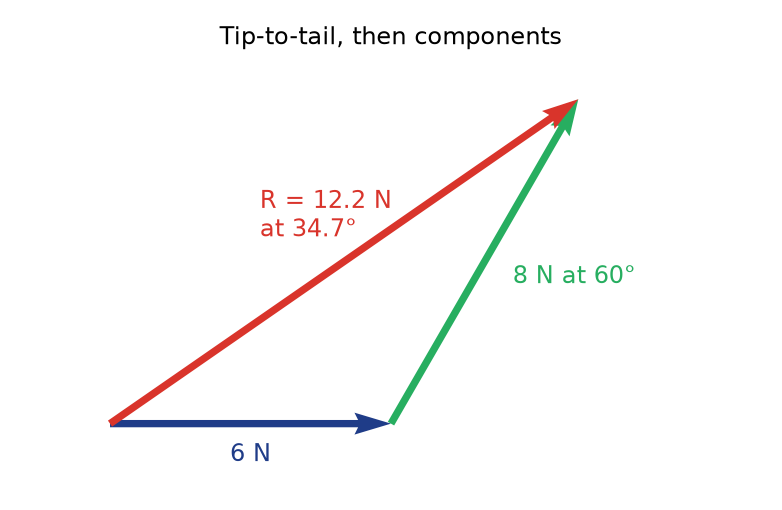
6 N east plus 8 N at 60° above east.
⚪ Worked example: Two forces at 60°
- Force 1: 6 N along x → (6, 0).
- Force 2: 8 N at 60° → (8 cos 60°, 8 sin 60°) = (4.00, 6.93) N.
- Add: Rx = 6 + 4.00 = 10.00 N, Ry = 6.93 N.
- R = √(10² + 6.93²) = √148.0 = 12.2 N; θ = tan−1(6.93 ÷ 10) = 34.7° above the 6 N force.
- Notice: not 6 + 8 = 14 N, and not √(6² + 8²) = 10 N (that is only for 90°).
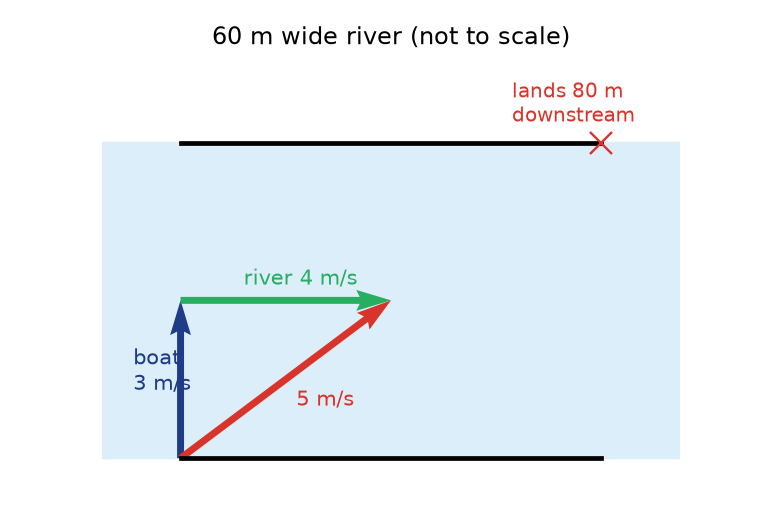
⚪ Worked example: Crossing a river
- Boat 3 m/s straight across; river flows 4 m/s; river 60 m wide.
- Resultant speed = √(3² + 4²) = 5 m/s at tan−1(4 ÷ 3) = 53° from straight across.
- Time to cross uses ONLY the across part: t = 60 ÷ 3 = 20 s.
- Drift downstream = 4 × 20 = 80 m. Total displacement = 5 × 20 = 100 m (check: √(60² + 80²) = 100 ✓).
⚪ Worked example: Change in velocity is a vector subtraction
- A ball hits the floor at 5 m/s downward and bounces up at 4 m/s. Take up as positive.
- u = −5 m/s, v = +4 m/s.
- Δv = v − u = 4 − (−5) = +9 m/s (upward). Not 1 m/s! Direction reversal makes the change bigger.
🕵️ How examiners trick you
- Calculator in RAD mode: cos 60° comes out as −0.95. Check: cos 60° must be 0.5.
- Angle measured from the vertical: then the horizontal part is F sin θ, not F cos θ. Always use "cos goes with the side next to the angle".
- Scale drawing questions: they mark the scale (e.g. 1 cm = 2 N), the arrows, and the measured angle. State all three.
- Speed vs velocity for a full lap of a track: average speed is not zero, average velocity is.
🔗 Links to other topics
Every SUVAT quantity except t is a vector, which is why up/down signs matter so much (topic 2). Projectile motion on the site uses components exactly like the river.
Any angle: split into components, add, rebuild.
Perpendicular motions are independent (river crossing time).
Δv = v − u with signs: a bounce gives a big Δv.
2.1 Describing motion: averages and signs
🔬 Going deeper: why it works
Average speed = total distance ÷ total time. It is NOT the average of the speeds unless you spend equal times at each speed. If you spend more time going slowly, the average is pulled towards the slow speed.
Sign of acceleration: "negative acceleration" does not always mean slowing down. Slowing down happens when a and v have opposite signs. If both are negative (moving in the − direction and accelerating in the − direction), the object speeds up.
⚪ Worked example: The average-speed trap (two-stage journey)
- Drive 30 km at 60 km/h, then 30 km at 40 km/h.
- Time 1 = 30 ÷ 60 = 0.50 h. Time 2 = 30 ÷ 40 = 0.75 h.
- Average speed = 60 km ÷ 1.25 h = 48 km/h, not 50 km/h.
- In SI: 48 ÷ 3.6 = 13.3 m s−1.
⚪ Worked example: Signs telling the story
- Up is positive. A ball is thrown up; on the way up v = +, a = −9.8 → opposite signs → slowing.
- At the top v = 0 but a is STILL −9.8 m/s² (gravity never switches off).
- On the way down v = −, a = − → same signs → speeding up downward.
🕵️ How examiners trick you
- "Average velocity" for a round trip is zero, even if the average speed is large.
- "At the highest point the acceleration is zero" is FALSE. Only the velocity is zero.
- Uniform velocity means a = 0, not "no motion".
- "Decelerating at −3 m/s²" sometimes means a = −3 m/s² and sometimes just "slowing by 3 m/s each second". Either way, use a = −3 in SUVAT if forward is positive.
🔗 Links to other topics
The constant-acceleration average v̄ = (u + v) ÷ 2 is the trapezium height on the v–t graph and leads straight to the SUVAT derivations on the next page.
Average speed = total distance ÷ total time.
Slowing = v and a with opposite signs.
At the top of a throw: v = 0, a = −9.8 m/s².
2.2–2.4 Where the three equations come from
🔬 Going deeper: why it works
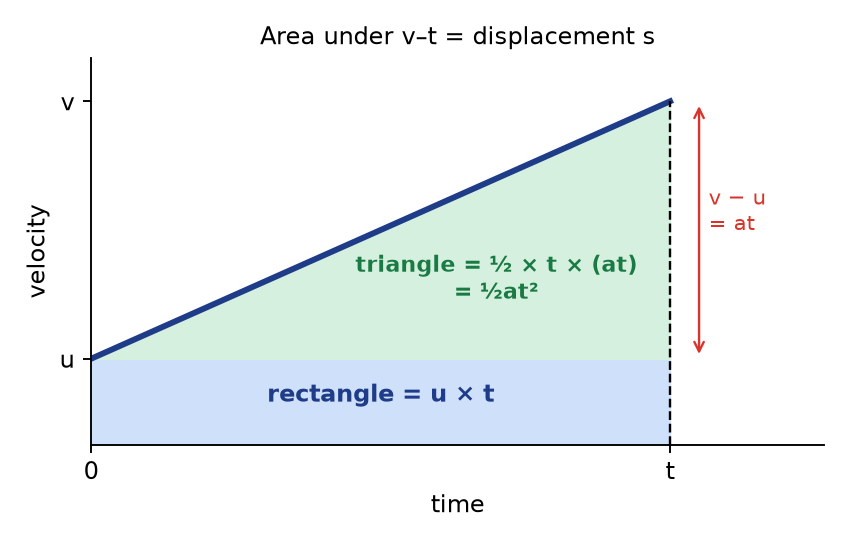
Draw the v–t graph of constant acceleration: a straight line from u (at t = 0) to v (at time t). Everything comes from two facts: gradient = acceleration and area = displacement.
📐 Derivation 1: v = u + at
Gradient = rise ÷ run = (v − u) ÷ t = a. Multiply both sides by t: v − u = at, so v = u + at.
📐 Derivation 2: s = ut + ½at²
Area = rectangle + triangle. Rectangle: height u, width t → ut. Triangle: width t, height (v − u) = at → ½ × t × at = ½at². Add: s = ut + ½at².
(Bonus: the area is also a trapezium: s = ½(u + v)t. That is the "average velocity × time" idea from 2.1.)
📐 Derivation 3: v² = u² + 2as
Take s = ½(u + v)t and swap t for (v − u) ÷ a (from equation 1):
s = ½(u + v)(v − u) ÷ a → 2as = (v + u)(v − u) = v² − u². So v² = u² + 2as. Time has been removed, which is why this is the equation to use when t is not involved.
⚪ Worked example: Choosing the equation by the missing letter
- Write the five letters s u v a t. Fill in the three you know and the one you want.
- The letter that is neither known nor wanted tells you the equation: no s → v = u + at; no v → s = ut + ½at²; no t → v² = u² + 2as.
- E.g. "From 20 m/s, brakes at 5.0 m/s². How far to stop?" Know u = 20, v = 0, a = −5.0; want s; t missing → v² = u² + 2as: 0 = 400 − 10s → s = 40 m.
🕵️ How examiners trick you
- A "trick" question with two unknowns: they give u and t but want s, and also mention a speed later. Read carefully which value belongs to which stage.
- "Comes to rest" or "at the highest point" is a hidden v = 0. "Dropped" or "from rest" is a hidden u = 0.
- Constant velocity: a = 0, so s = vt. Do not force SUVAT.
- SUVAT needs CONSTANT acceleration. In a multi-stage journey, use it separately for each stage.
🔗 Links to other topics
The derivation is pure graph work (2.5). The ½ and the t² in s = ut + ½at² are why s vs t² is a straight line (1.2d) and why a time uncertainty counts double.
Gradient of v–t → v = u + at.
Area of v–t → s = ut + ½at² (and s = ½(u+v)t).
Eliminate t → v² = u² + 2as.
2.2–2.4 Exam special 1: objects thrown upward
🔬 Going deeper: why it works
Pick a direction as positive (usually up) and keep it for the whole flight. Then a = −9.8 m/s² the entire time: going up, at the top, and coming down. You do NOT need to split the flight into "up" and "down" unless you want to; one equation covers the whole thing, and the signs tell you where the ball is.
Symmetry (when it lands at the same height it was thrown from): time up = time down, and it lands with the same speed it was thrown, just in the opposite direction.
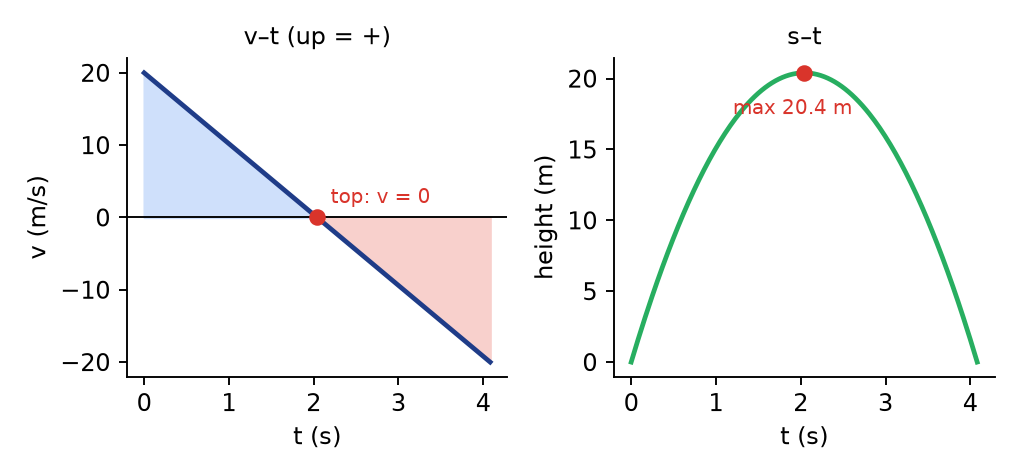
Thrown up at 20 m/s. The v–t line is straight all the way (gradient −9.8).
⚪ Worked example: Thrown up at 20 m/s from the ground
- Max height: v = 0, u = 20, a = −9.8. v² = u² + 2as → 0 = 400 − 19.6s → s = 20.4 m.
- Time to top: v = u + at → 0 = 20 − 9.8t → t = 2.04 s. Back to the hand: 2 × 2.04 = 4.08 s.
- Where is it at t = 3.0 s? s = 20(3) − 4.9(3²) = 60 − 44.1 = 15.9 m above the hand.
- Velocity at t = 3.0 s: v = 20 − 9.8(3) = −9.4 m/s. The minus sign means it is already falling.
- Lands at v = −20 m/s (symmetry).
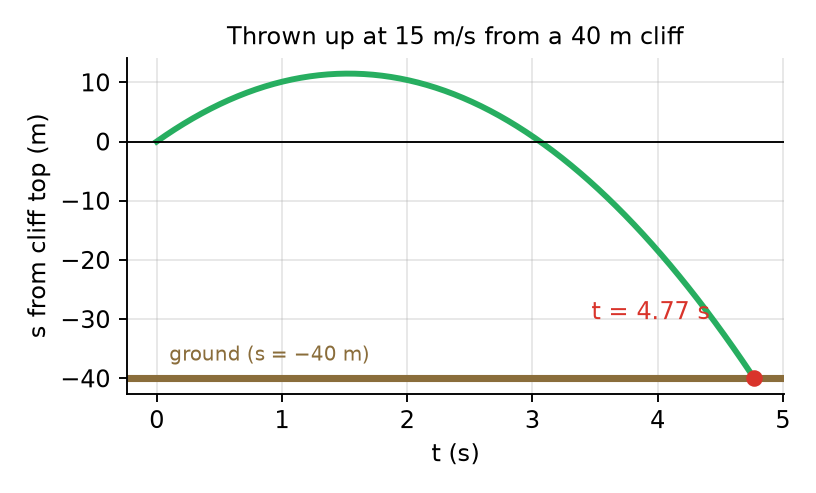
⚪ Worked example: Thrown up from the top of a 40 m cliff at 15 m/s
- Up positive, origin at the cliff top. Ground is BELOW the start: s = −40 m. u = +15, a = −9.8.
- s = ut + ½at² → −40 = 15t − 4.9t² → 4.9t² − 15t − 40 = 0.
- t = [15 + √(15² + 4 × 4.9 × 40)] ÷ (2 × 4.9) = (15 + √1009) ÷ 9.8 = (15 + 31.76) ÷ 9.8 = 4.77 s (ignore the negative root).
- Landing velocity: v = 15 − 9.8 × 4.77 = -31.8 m/s. Check with v² = 15² + 2(−9.8)(−40) = 1009 → v = −31.8 m/s ✓.
🕵️ How examiners trick you
- Using s = +40 for a cliff below the start point. The ground is below, so s = −40.
- "Total time in the air" vs "time to the highest point": a factor of 2.
- "How high above the ground" when thrown from a cliff: add the cliff height to the rise.
- Giving a speed with a minus sign when they asked for speed (speed is just the size: 31.8 m/s).
Up = +, so a = −9.8 m/s² all the time.
Top: v = 0. Same level: tup = tdown, lands at −u.
Below the start point → negative s.
2.2–2.4 Exam special 2: two-stage (and more) motion
🔬 Going deeper: why it works
SUVAT only works while acceleration is constant. When the motion changes (accelerate, cruise, brake), treat each part as a separate stage. The key link: the final velocity of one stage is the initial velocity of the next. Drawing the v–t graph first nearly always makes it easy.
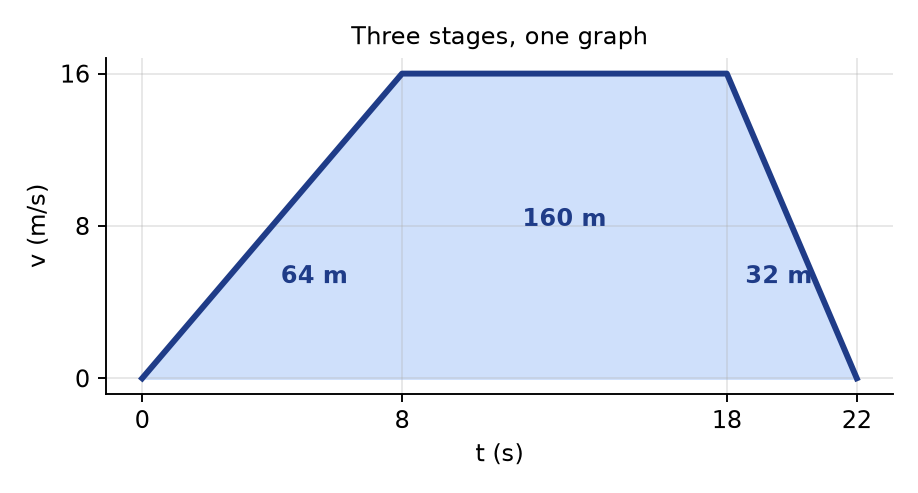
Car: 2.0 m/s² for 8.0 s, steady for 10 s, then stops in 4.0 s.
⚪ Worked example: Accelerate, cruise, brake
- Stage 1: u = 0, a = 2.0, t = 8.0. v = 0 + 2.0 × 8.0 = 16 m/s. s₁ = ½ × 2.0 × 8.0² = 64 m.
- Stage 2: constant 16 m/s for 10 s → s₂ = 16 × 10 = 160 m (a = 0).
- Stage 3: u = 16, v = 0, t = 4.0. a = (0 − 16) ÷ 4.0 = −4.0 m/s². s₃ = ½(16 + 0)(4.0) = 32 m.
- Total = 64 + 160 + 32 = 256 m in 22 s. Average velocity = 256 ÷ 22 = 11.6 m/s.
- Check by area: triangle + rectangle + triangle = same numbers ✓.
⚪ Worked example: Rocket: engine on, then engine off
- Stage 1 (engine): from rest, a = +5.0 m/s² for 4.0 s. v = 20 m/s, h₁ = ½ × 5.0 × 16 = 40 m.
- Stage 2 (free flight): u = +20 (from stage 1!), a = −9.8, at the top v = 0.
- 0 = 20² − 2 × 9.8 × h₂ → h₂ = 400 ÷ 19.6 = 20.4 m.
- Maximum height = 40 + 20.4 = 60.4 m. (The rocket keeps rising after the engine stops.)
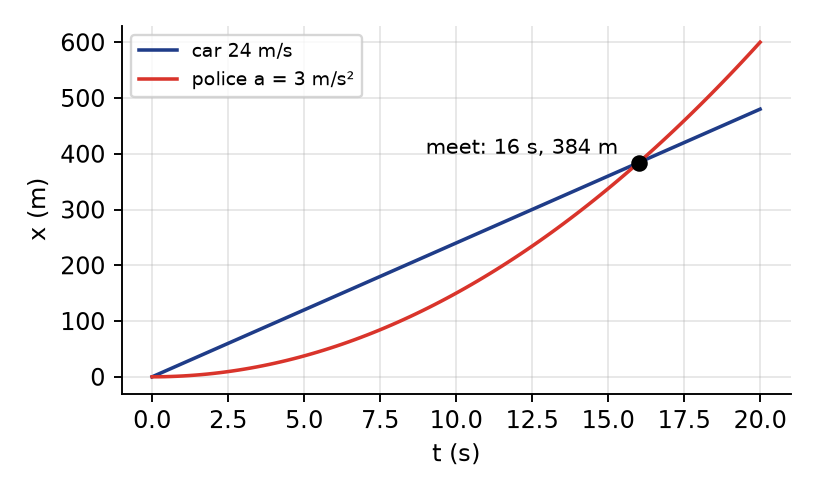
⚪ Worked example: Catch-up problem
- A car passes a parked police car at a constant 24 m/s. At that instant the police car starts from rest with a = 3.0 m/s².
- Same position when 24t = ½ × 3.0 × t² → 24t = 1.5t² → t = 24 ÷ 1.5 = 16 s (t = 0 is the start).
- Distance: 24 × 16 = 384 m. Police speed then: 3.0 × 16 = 48 m/s (double the car: always true for this kind of chase).
⚪ Worked example: Thinking distance + braking distance
- Driver at 20 m/s, reaction time 0.70 s, then brakes at 5.0 m/s².
- Thinking (constant speed): 20 × 0.70 = 14 m.
- Braking: 0 = 20² − 2 × 5.0 × s → s = 40 m.
- Stopping distance = 54 m.
🕵️ How examiners trick you
- Using the acceleration of stage 1 in stage 2.
- Forgetting the constant-speed part (a = 0, so s = vt).
- Asking for the "total time" when you only found one stage's time.
- A graph with different units in each stage (km/h and m/s).
One stage = one constant acceleration.
Final v of one stage = initial u of the next.
Sketch the v–t graph first; areas check your answer.
2.5 Reading graphs like an examiner
🔬 Going deeper: why it works
Why is area = displacement? For a tiny time slice Δt, velocity is almost constant, so the distance in that slice is v × Δt, a thin rectangle under the line. Add all the slices and you get the area. Area below the time axis is negative displacement (moving backwards).
Curved x–t graphs: the velocity at one instant is the gradient of the tangent (a straight line that just touches the curve there). Steeper tangent = faster.
Connecting the three graphs: x–t gradient → v–t; v–t gradient → a–t. v–t area → change in x; a–t area → change in v.
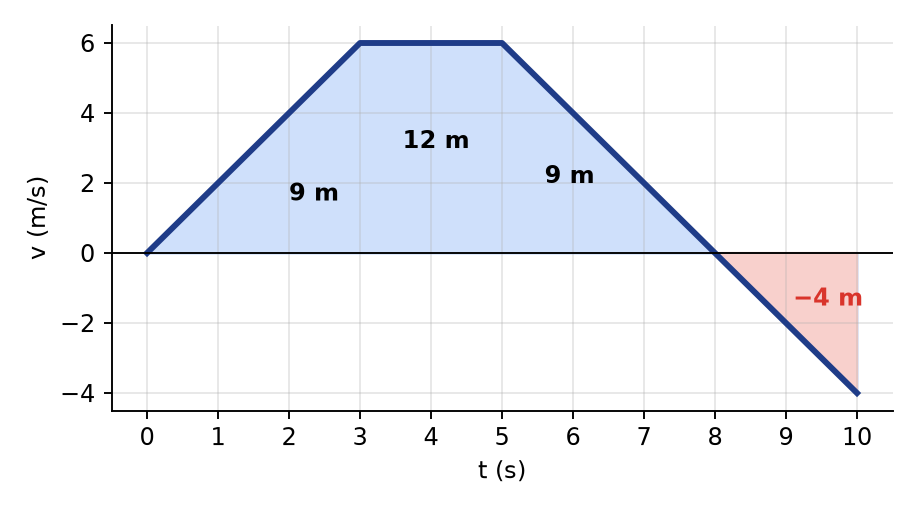
A journey that goes backwards at the end.
⚪ Worked example: Reading everything off one v–t graph
- 0–3 s: a = 6 ÷ 3 = 2 m/s². 3–5 s: a = 0. 5–10 s: a = (−4 − 6) ÷ 5 = −2 m/s² (one straight line → one acceleration, even across the axis).
- Areas: 0–3 s: ½ × 3 × 6 = 9 m. 3–5 s: 2 × 6 = 12 m. 5–8 s: ½ × 3 × 6 = 9 m. 8–10 s: ½ × 2 × (−4) = −4 m.
- Displacement after 10 s = 9 + 12 + 9 − 4 = 26 m from the start.
- Distance travelled = 9 + 12 + 9 + 4 = 34 m (all areas positive).
- Farthest from the start at t = 8 s (where v = 0 and it turns around): 30 m.
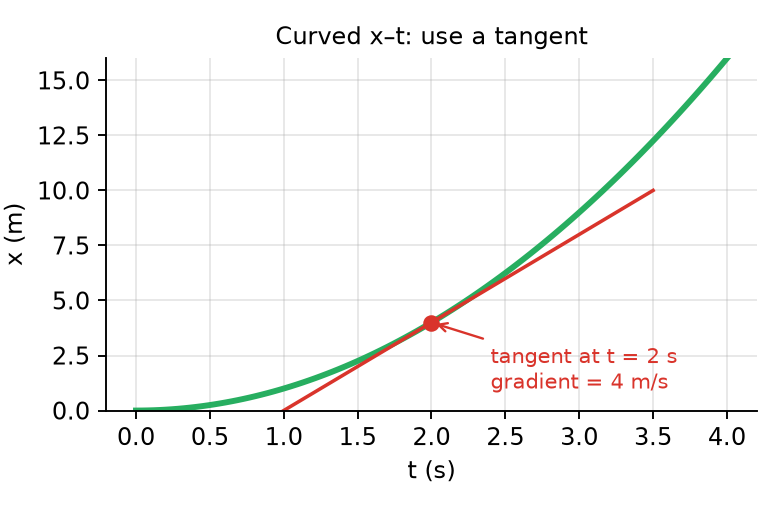
⚪ Worked example: Instantaneous velocity from a curve
- x = t² (in m). Draw the tangent at t = 2 s, where x = 4 m.
- Pick two far-apart points on the tangent: (0.5 s, −2 m) and (3.5 s, 10 m).
- Gradient = (10 − (−2)) ÷ (3.5 − 0.5) = 12 ÷ 3 = 4 m/s.
- Average velocity 0–2 s is only 4 ÷ 2 = 2 m/s. Instantaneous ≠ average.
⚪ Worked example: Ball thrown up: all three graphs
- a–t: a flat line at −9.8 m/s² for the whole flight.
- v–t: a straight line sloping down from +u, crossing zero at the top.
- x–t: an upside-down parabola; its top (gradient 0) matches v = 0.
🕵️ How examiners trick you
- A v–t line crossing the axis: the object turns around. It does NOT mean it stopped for a while.
- A flat x–t line high on the graph means stopped, not "fast".
- The worksheet graphs start at v = 2 m/s, not 0: read the initial velocity off the axis.
- Gradient of a v–t graph is acceleration, NOT velocity. Height is velocity.
- "Distance" vs "displacement" from a graph with parts below the axis: different answers.
- Axes in minutes or km: convert before calculating SI values.
🔗 Links to other topics
Gradients here use the same rise ÷ run as 1.2d. The area method IS the derivation of SUVAT. Velocity and acceleration are vectors (1.3), so the sign of the v–t line is direction.
Gradient x–t = v; gradient v–t = a; tangent for curves.
Area v–t = displacement (below axis = negative).
Displacement ≠ distance when the line crosses the axis.
★ How it all fits together
🔬 Going deeper: why it works
Examiners love questions that join topics. Here is the big one, which uses almost everything in the course.
⚪ Worked example: Measuring g with a dropped ball (uncertainty + kinematics)
- A ball is dropped from h = (1.50 ± 0.01) m and takes t = (0.55 ± 0.01) s.
- From s = ut + ½at² with u = 0: h = ½gt², so g = 2h ÷ t².
- g = 2 × 1.50 ÷ 0.55² = 3.00 ÷ 0.3025 = 9.92 m s−2.
- %h = 0.01 ÷ 1.50 = 0.67%. %t = 0.01 ÷ 0.55 = 1.82%, squared → 3.64%. Total = 4.30% (the 2 is exact).
- Δg = 0.0430 × 9.92 = 0.43 → g = (9.9 ± 0.4) m s−2. The accepted 9.8 is inside the range, so the result agrees.
- Weak link: time (3.6% of the 4.3%). Improve: light gates, or a bigger drop height.
🗺️ The map of links
| If you see… | …think of |
|---|---|
| A gradient | rise ÷ run; units y ÷ x; Δm from max/min lines |
| t² anywhere | s = ½at²; uncertainty doubles; plot s vs t² |
| "up" and "down" | vectors → signs; g = −9.8 if up is + |
| A line not through the origin | systematic (zero) error |
| Scatter of points | random error → repeat, average |
| km/h, g/cm³, cm² | convert to SI first (squared prefixes!) |
| v–t graph | gradient = a, area = s, crossing = turn around |
🧭 A 5-step routine for any long question
- Draw a sketch with a + direction marked.
- Convert everything to SI.
- List s u v a t (one list per stage).
- Pick the equation by the missing letter; keep signs.
- Answer with unit, sensible s.f., and ± if data had uncertainties.
Measuring g = kinematics + power-rule uncertainty + graphs.
Always: sketch, SI, list, choose, sign, unit.