What's on the test
Straight from our study guide. Learn each section top to bottom, then do the practice at the very end.
| Topic | You need to be able to… |
|---|---|
| 1.1 SI units & orders of magnitude | Use SI units properly, scientific notation, metric prefixes, compare to nearest order of magnitude |
| 1.2 Uncertainties & errors | Random vs systematic errors, absolute / fractional / % uncertainty, combine uncertainties (+ − × ÷ powers), uncertainty in gradients & intercepts |
| 1.3 Vectors & scalars | Solve vector problems graphically and algebraically |
| 2 Kinematics | Use the 1st, 2nd and 3rd equations of motion; get velocity from an x–t graph, acceleration and displacement from a v–t graph |
Suggested plan: Mon–Tue = Topic 1 · Wed = Vectors + equations · Thu = graphs + practice · Fri = cheat sheet only.
1.1 SI units & orders of magnitude
Physics uses one agreed set of units so everyone's numbers match. The base SI units you'll use most:
| Quantity | Unit | Symbol |
|---|---|---|
| length | metre | m |
| mass | kilogram | kg |
| time | second | s |
| current | ampere | A |
| temperature | kelvin | K |
| amount | mole | mol |
Everything else is derived from these, e.g. speed = m s−1, acceleration = m s−2.
Prefixes
n = 10−9 · µ = 10−6 · m = 10−3 · c = 10−2 · k = 103 · M = 106 · G = 109
Move the decimal 4 places → 4.5 × 10⁻⁴ m. Since 1 µm = 10⁻⁶ m: 4.5 × 10⁻⁴ ÷ 10⁻⁶ = 450 µm.
1.2 Errors: precision vs accuracy
Every measurement has errors. Our class example is a cart travelling from A to B — we measure distance and time, and both have errors.
Accurate = close to the true value.
Ruler: 0.82, 0.85, 0.82 m but true distance is 0.75 m → precise but not accurate (maybe a faulty ruler).
Stopwatch: 1.23, 1.15, 1.37 s, average 1.25 s = true value → accurate but not precise (random fluctuations).
Two types of error
| Systematic error | Random error | |
|---|---|---|
| Cause | Faulty equipment or the same mistake every time (e.g. voltmeter reads 1 V when disconnected = zero error) | Random fluctuations (e.g. temperature varying in a liquid, reaction time) |
| Effect | Shifts all readings the same way → affects accuracy | Readings scatter → affects precision |
| Fix | Subtract the zero error / calibrate. Repeating does NOT help | Repeat readings and average (and stir!) |
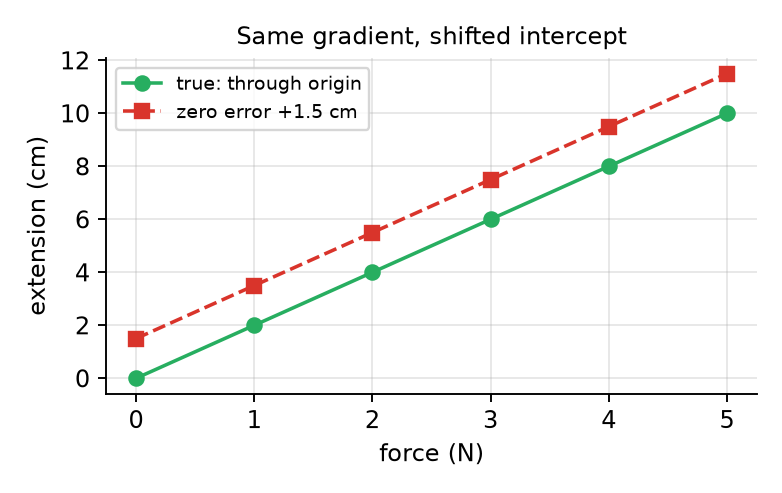
Rule to remember: small systematic error → accurate. Small random error → precise and reliable.
Absolute, fractional & % uncertainty
The uncertainty tells you the range the real value could be in. Write it as best estimate ± uncertainty.
How big is the reading uncertainty?
- Analogue (ruler, thermometer with a scale): ± half the smallest division.
- Digital (stopwatch, digital meter): ± the smallest division it shows.
- Length needs two readings (left end AND right end), so add both: stick read to ±0.05 cm at each end → 49 ± (0.05 + 0.05) = 49 ± 0.1 cm.
Repeated readings
Uncertainty = (max − min) ÷ 2 (half the range).
Half range = (1.92 − 1.24)/2 = 0.340. Add reading error 0.005 → 0.345 → round to 2 s.f. → 1.50 ± 0.35 m s⁻¹.
The three forms
| Form | Formula | Unit? |
|---|---|---|
| Absolute | Δx | same unit as x |
| Fractional | Δx / x | none |
| Percentage | (Δx / x) × 100% | % |
Backwards: 80.0 cm with 2.5% → Δx = 0.025 × 80.0 = 2.0 → 80.0 ± 2.0 cm.
% difference = |measured − true| / true × 100% → tells you about accuracy. E.g. 0.82 m vs true 0.75 m → 9.3% off → not accurate.
Combining uncertainties
When you calculate something from measured values, the uncertainties carry through. There are just three rules:
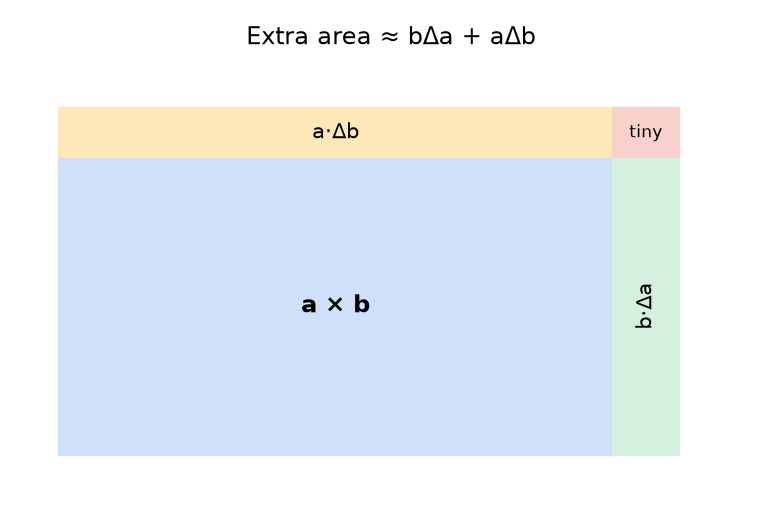
2. Multiply or divide → add the fractional / % uncertainties. Δz/z = Δx/x + Δy/y
3. Power → multiply the % uncertainty by the power. x² → 2 × %x, √x → ½ × %x. Constants (π, 2, g if given exact) have no uncertainty.
Rise = 76.0 − 21.0 = 55.0 °C. Δ = 0.5 + 0.5 = 1.0 → 55.0 ± 1.0 °C (1.8%).
① Value: s = 0.83/1.25 = 0.664 m s⁻¹
② % uncertainties: 0.02/0.83 = 2.4%, 0.07/1.25 = 5.6% → total 8.0%
③ Absolute: 0.080 × 0.664 = 0.053
④ Answer: 0.66 ± 0.05 m s⁻¹
KE = 0.5 × 0.200 × 25 = 2.5 J. % = 2.5% + 2 × 4% = 10.5% → ±0.26 → 2.5 ± 0.3 J.
t = √(10/9.8) = 1.01 s. % = ½ × 1% = 0.5% → 1.01 ± 0.01 s.
Error bars, gradients & intercepts
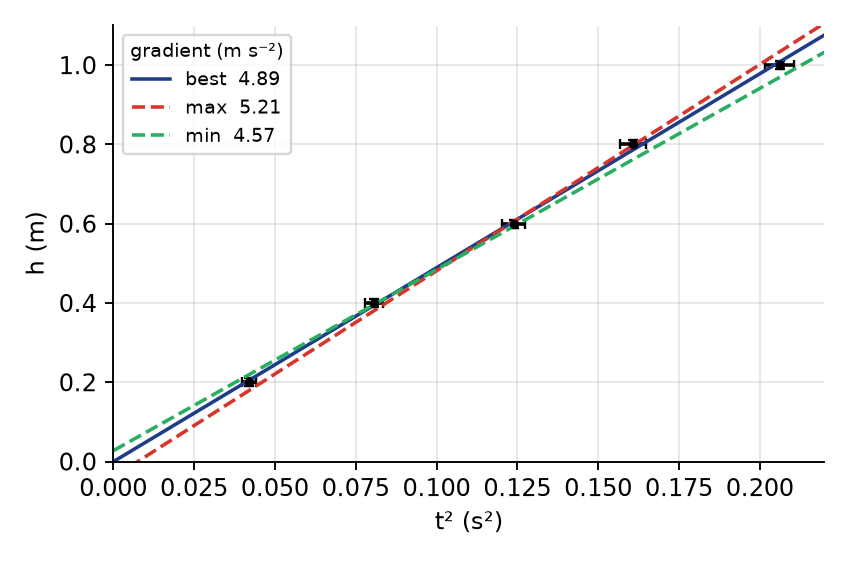
On a graph, each point gets error bars (± the uncertainty) in x and y. Together they make an error box — the true point could be anywhere inside it.
- Best fit line – goes through all the error boxes.
- Max line – steepest line that still passes through every box.
- Min line – least steep line that still passes through every box.
- No error bars? Judge max/min lines by eye.
or: gradient of best line − gradient of worst acceptable line.
Δintercept = best intercept − worst intercept
Δ = (2.30 − 1.90)/2 = 0.20 → gradient = 2.1 ± 0.2.
1.3 Vectors & scalars
Vector = size AND direction: displacement, velocity, acceleration, force.
A vector is drawn as an arrow – the length shows the size. A 20 m s⁻¹ arrow is twice as long as a 10 m s⁻¹ arrow.
Adding vectors
Graphically: draw to scale, tip-to-tail; the resultant goes from the start of the first to the tip of the last. Measure its length and angle.
Algebraically: same line → add with signs (right/north +, left/south −). At right angles → Pythagoras + tan.
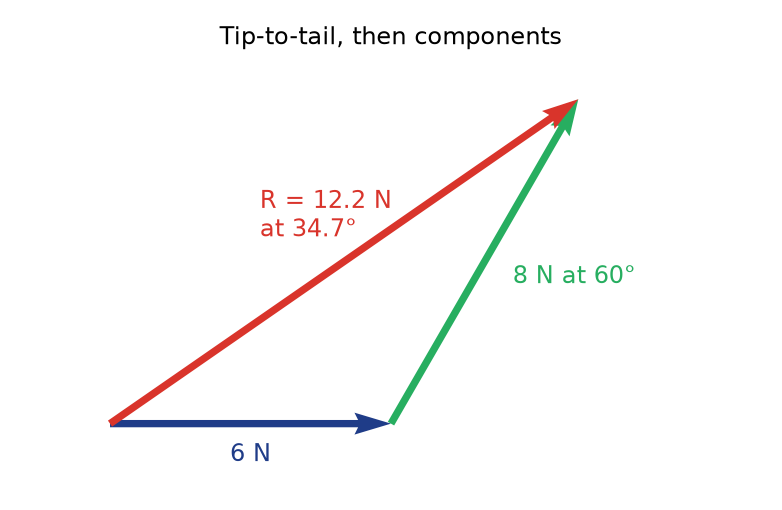
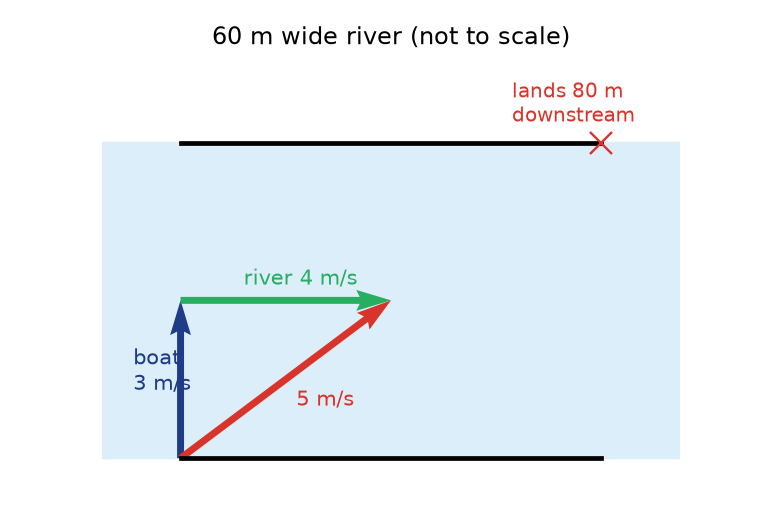
Resultant = √(3² + 4²) = 5 m. Angle: tan θ = 4/3 → θ = 53° north of east.
Distance walked = 7 m (scalar) but displacement = 5 m at 53° N of E (vector).
2 Kinematics – describing motion
Reference frame: where you measure from. Sitting at your desk you're still relative to the classroom but moving relative to the Sun. We usually use "standing still on Earth", with +x to the right (and up/north as +).
Drive 60 miles out, 20 back → distance 80, displacement 40.
Speed = distance/time (scalar). Velocity v = Δx/Δt (vector). Acceleration a = Δv/Δt.
The equations of motion
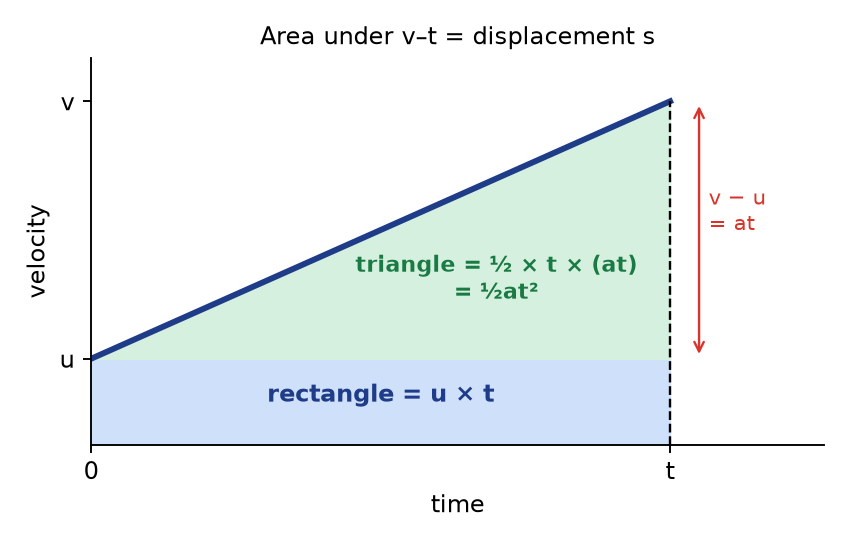
Only for constant acceleration. Write down what you know (u, v, a, t, s), pick the equation without the one you don't know and don't need.
| # | Equation | Missing |
|---|---|---|
| 1st | v = u + at | s |
| 2nd | s = ut + ½at² | v |
| 3rd | v² = u² + 2as | t |
| avg | s = ½(u + v)t | a |
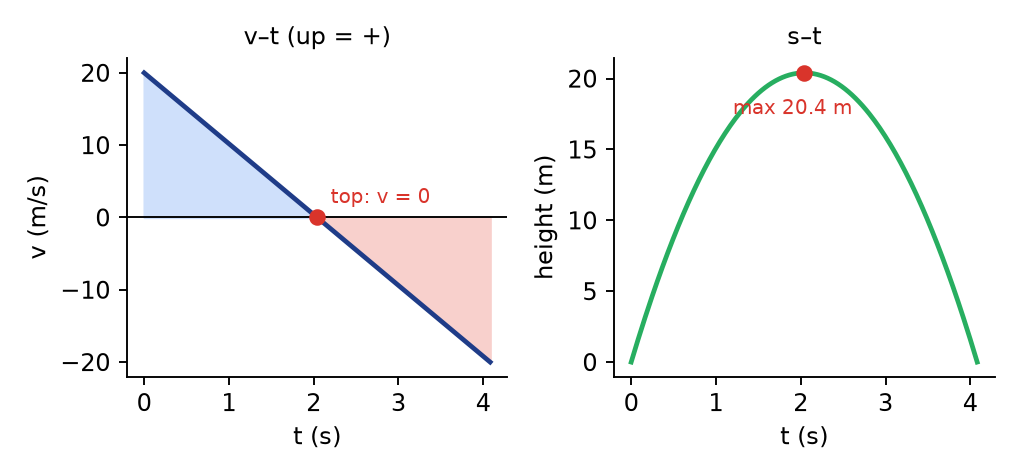
(Our slides write u as v₀ and s as Δx – same thing.) Free fall: a = g = 9.8 m s⁻² downward. "Dropped" means u = 0. At the top of a throw, v = 0.
0 = 24 + (−5.0)t → t = 4.8 s
v̄ = (0 + 38)/2 = 19 m s⁻¹, s = 19 × 5.0 = 95 m
Take down as +: 42 = 0 + ½(9.8)t² → t² = 8.57 → t = 2.9 s
At top v = 0: 0 = u² − 2(9.8)(15.8) → u = 17.6 m s⁻¹. Time up: t = 17.6/9.8 = 1.80 s, so up and down = 3.6 s.
Motion graphs
| Graph | Gradient means | Area means |
|---|---|---|
| x–t (displacement–time) | velocity | – |
| v–t (velocity–time) | acceleration | displacement |
| a–t | – | change in velocity |
Reading shapes
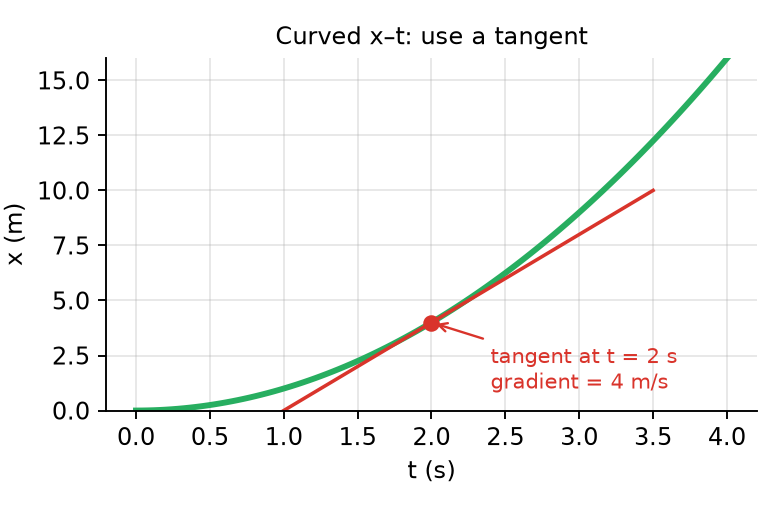
- x–t horizontal → stationary. Straight sloping → constant velocity. Negative slope → constant velocity backwards. Curve → velocity changing (use a tangent for instantaneous velocity).
- v–t horizontal at 0 → stationary. Horizontal above 0 → constant velocity. Positive slope → accelerating, negative slope → decelerating. Below the axis → moving the opposite way.
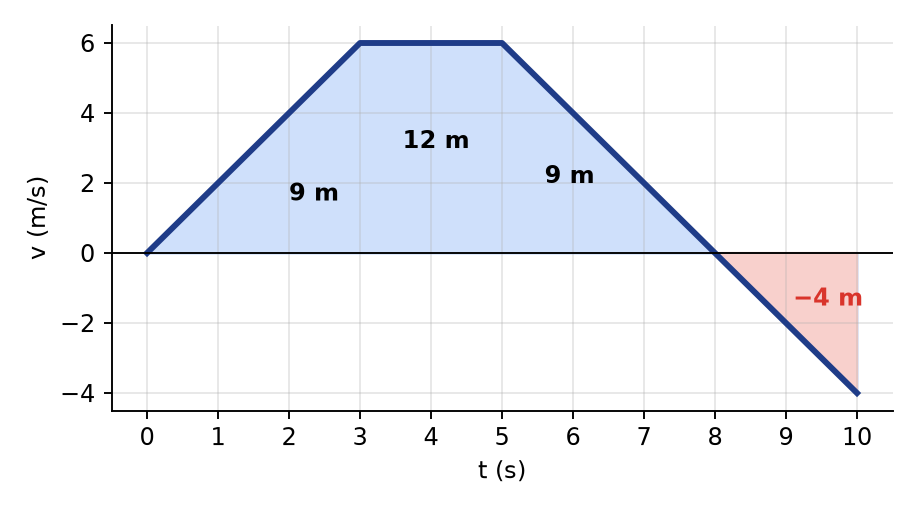
a = gradient = (12 − 4)/4 = 2 m s⁻². s = area of trapezium = ½(4 + 12) × 4 = 32 m.
One-page cheat sheet
- Analogue ± ½ smallest division · digital ± smallest division · repeats ± ½ range
- + / − → add absolute · × / ÷ → add % · power n → n × %
- Uncertainty to 1–2 s.f.; match decimal places
- Systematic → accuracy (fix: zero/calibrate) · random → precision (fix: repeat)
- Δgradient = (max − min)/2
- v = u + at · s = ut + ½at² · v² = u² + 2as · s = ½(u+v)t · g = 9.8 m s⁻²
- x–t gradient = v · v–t gradient = a · v–t area = s
- Vectors: tip-to-tail, Pythagoras, tan θ = opp/adj
Practice questions
From our class worksheets. Try each one on paper first, then open the worked answer.
- An ammeter has a zero offset error. Does this affect precision, accuracy, both or neither?
Worked answer
Only accuracy (C). A zero error is systematic – it shifts every reading by the same amount, so readings can still be close together. - A ball's fall time from the Eiffel Tower: 7.83 s, 7.56 s, 7.93 s. Give the average and random error.
Worked answer
Average = (7.83+7.56+7.93)/3 = 7.77 s. Half range = (7.93 − 7.56)/2 = 0.185 → 2 s.f. → 7.77 ± 0.19 s (A). - Two lengths (12.4 ± 0.1) cm and (8.3 ± 0.2) cm. Find the total.
Worked answer
12.4 + 8.3 = 20.7 cm; Δ = 0.1 + 0.2 = 0.3 → 20.7 ± 0.3 cm. - d = (100 ± 2) m, t = (20.0 ± 0.5) s. Find v = d/t with uncertainty.
Worked answer
v = 5.0 m s⁻¹. % = 2% + 2.5% = 4.5%. Δv = 0.045 × 5.0 = 0.23 → 5.0 ± 0.2 m s⁻¹. - Radius r = 4.3 ± 0.1 cm. Find (a) the circumference and (b) the area with uncertainties.
Worked answer
% in r = 0.1/4.3 = 2.3%.
(a) C = 2πr = 27.0 cm, same 2.3% → ±0.6 → 27.0 ± 0.6 cm.
(b) A = πr² = 58.1 cm², % = 2 × 2.3 = 4.7% → ±2.7 → 58 ± 3 cm². - F = mv²/r with m = 2.3 ± 0.2 kg, v = 15 ± 1 m s⁻¹, r = 3.4 ± 0.2 m. Find F.
Worked answer
F = 2.3 × 225 / 3.4 = 152 N. % = 8.7% + 2(6.7%) + 5.9% = 27.9%. ΔF = 0.279 × 152 = 42 → F = (1.5 ± 0.4) × 10² N. - Cylinder: height uncertainty 5%, diameter 1%. Uncertainty in volume?
Worked answer
V = π(d/2)²h → 2 × 1% + 5% = 7% (D). - Rectangle L = (2 ± 0.1) cm, W = (3 ± 0.2) cm. Uncertainty in the perimeter?
Worked answer
P = 2L + 2W → Δ = 2(0.1) + 2(0.2) = 0.6 cm (D). - pV = nRT, uncertainties P 2%, V 6%, T 1%. Uncertainty in n?
Worked answer
n = pV/RT → 2 + 6 + 1 = 9% (C). - EPE = ½kx², k ± 2%, x ± 3%. Uncertainty in EPE?
Worked answer
2% + 2 × 3% = 8% (A). - Max gradient line = 4.8, min = 4.2. Best line = 4.5. Quote the gradient.
Worked answer
Δ = (4.8 − 4.2)/2 = 0.3 → 4.5 ± 0.3. - A boat goes 4 m s⁻¹ north across a river flowing 3 m s⁻¹ east. Resultant velocity?
Worked answer
√(4² + 3²) = 5 m s⁻¹; tan θ = 3/4 → θ = 37° east of north. - An object moving at 23 m s⁻¹ reaches 85 m s⁻¹ in 8.3 s. Acceleration?
Worked answer
a = (v − u)/t = (85 − 23)/8.3 = 7.5 m s⁻². - A plane reaches 240 m s⁻¹ in 11 s, travelling 1400 m. Average and initial velocity?
Worked answer
v̄ = 1400/11 = 127 m s⁻¹. v̄ = (u+v)/2 → u = 2(127.3) − 240 = 15 m s⁻¹. - A car brakes at −3.2 m s⁻² and stops in 210 m. Starting speed?
Worked answer
0 = u² + 2(−3.2)(210) → u² = 1344 → u = 36.7 m s⁻¹. - An object is thrown up at 35 m s⁻¹. Maximum height?
Worked answer
At top v = 0: 0 = 35² − 2(9.8)h → h = 1225/19.6 = 62.5 m. - A ball is thrown down at 8 m s⁻¹ off a cliff and lands 6 s later. Cliff height?
Worked answer
Down = +: s = 8(6) + ½(9.8)(6²) = 48 + 176.4 = 224 m. - An arrow is shot straight up and lands 8 s later. Initial velocity and max height?
Worked answer
Up takes 4 s: u = 9.8 × 4 = 39.2 m s⁻¹. h = ½(39.2)(4) = 78.4 m. - A v–t graph goes in a straight line from 0 to 20 m s⁻¹ in 5 s, then stays at 20 m s⁻¹ for 3 s. Find the acceleration and total displacement.
Worked answer
a = 20/5 = 4 m s⁻². Area = ½(5)(20) + 3(20) = 50 + 60 = 110 m.
Want more? Full practice set · Extra lessons · Projectile demo